
Logs
A live tail with levels coloured, a filter, and a heat strip of where the errors are.
Open logs from the Logs tile on a container, or from a diagnosis action. meshDeck loads the last 200 lines with timestamps, then follows the stream.
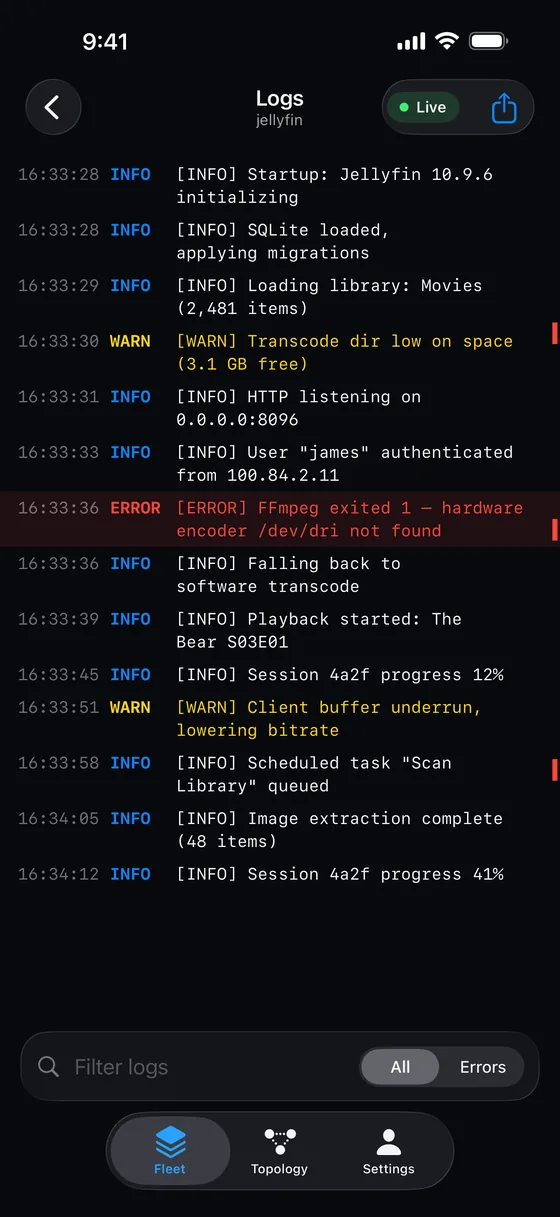 <figcaption>Errors tinted red, warnings amber, info blue.</figcaption>
Reading the stream
- Each row shows the time and the level (ERROR, WARN, INFO or DEBUG, or nothing if the level is unknown), then the text. Errors are red with a tinted row, warnings amber, info blue and debug grey.
- A thin heat strip on the right edge shows where errors and warnings cluster across the scrollback, so you can see the busy part at a glance.
- The pill at the top reads Live while the stream is following, and Paused when it is not.
Following
The view follows the newest line. Scroll up and it pauses, and a button appears: Jump to live (with a count of new lines while you were away).
Filtering
At the bottom:
- Filter logs narrows the view to lines containing your text (not case sensitive).
- Level switches between All and Errors. Despite the name, Errors shows both error and warning lines.
Sharing
The share button sends the lines currently visible (after any filter) as plain text, one per line as HH:mm:ss text.
A note on secrets
Logs are shown and shared exactly as the container wrote them. If a container prints a password, it will appear here. Only AI diagnosis masks logs before sending them anywhere.
Something missing or wrong? Tell us.