Topology
How the containers on a host depend on each other, with the broken link marked.
The Topology tab (on iPad, Topology in the sidebar) draws the containers on a host as a graph.
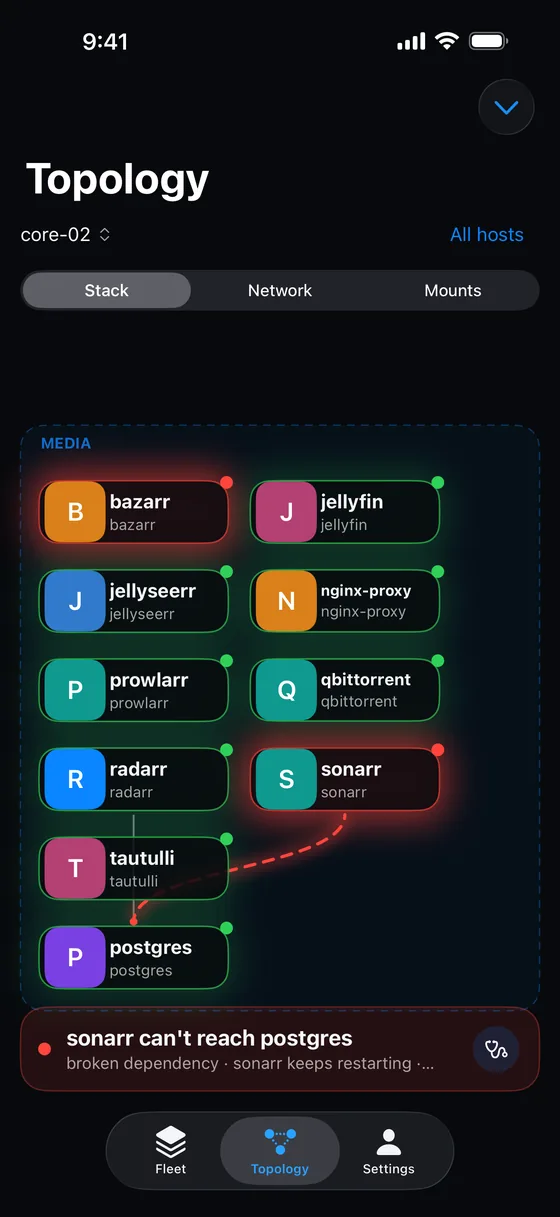 <figcaption>A broken dependency glows red, with a card at the bottom naming it.</figcaption>
Modes and grouping
A Mode control switches how the containers are grouped:
- Stack. By Docker Compose project.
- Network. By Docker network.
- Mounts. By shared volumes.
The menu at the top right, labelled with the current group or All, lets you focus on Everything or on one stack or network. Volumes appear as dashed chips. With two or more hosts, All hosts draws each host as its own captioned region.
Reading the graph
- A solid curved line with a blue dot at its end means “depends on”, with the condition where there is one.
- A dashed line is a mount.
- A broken link is a red, animated dashed glow.
- A chip shows the container’s avatar, name and status dot. Tap it to open the container. Press and hold for its quick menu.
A dependency counts as broken when the container it points to is not running, is unhealthy, or when the container itself keeps restarting.
The callout
When something is broken, a red card at the bottom names the first broken link, for example “sonarr can’t reach postgres”, with the reason. If AI diagnosis is set up, a stethoscope button opens What’s wrong? for that container.
Stress test
The menu contains a Stress test (50 nodes) switch. It draws fifty made-up containers to check performance and is not something you need.
Something missing or wrong? Tell us.